Lipi Script: Levels with hline()
Overview
Levels are horizontal lines plotted using the hline() function. These lines maintain a constant color and do not change across different bars. When hline() does not meet your requirements, you can explore alternative methods to plot levels in the Levels section of the documentation for plot().
Function Signature
The hline() function allows you to create horizontal levels with a simple and consistent appearance, ideal for marking key values or thresholds on the chart.
hline(price, title, color, style, linewidth, editable) → hlineLipi Script: Constraints and Features of hline()
Constraints of hline()
When compared to plot(), the hline() function has a few limitations:
-
Static Price Levels:
- The
priceparameter accepts only aninput int/floatargument. - This restricts the use of dynamic values like
closeor otherseries floatcalculations.
- The
-
Static Colors:
- The
colorparameter requires aninput intargument. - Dynamic colors, calculated on each bar as
series color, cannot be used.
- The
-
Limited Line Styles:
- The
linestyleparameter supports only three styles:hlineStyle.solidhlineStyle.dottedhlineStyle.dashed
- The
Example Use Case
The example below demonstrates how to use hline() in a “True Strength Index” (TSI) indicator to plot consistent horizontal levels. Despite its constraints, hline() is well-suited for plotting static levels that do not need dynamic updates or advanced customizations.
indicator("TSI")
myTSI = 100 * talib.tsi(close, 25, 13)
hline( 50, "+50", color.lime)
hline( 25, "+25", color.green)
hline(  0, "Zero", color.gray, style = hlineStyle.dashed)
hline(-25, "-25", color.maroon)
hline(-50, "-50", color.red)

plot(myTSI)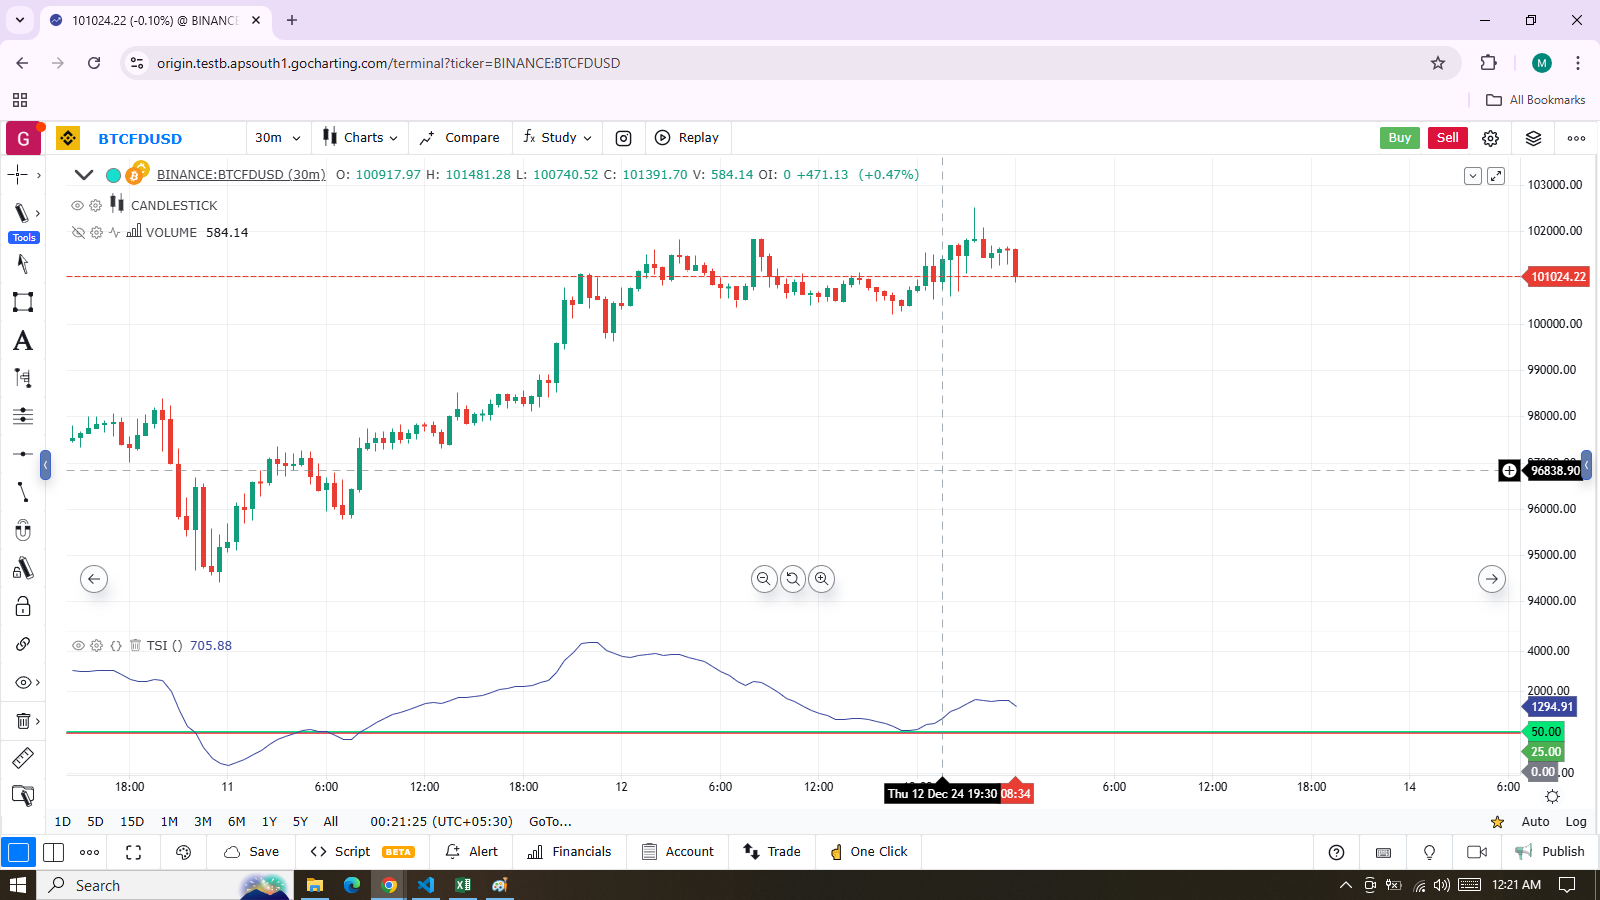
Lipi Script: Additional Notes on hline() and Fills Between Levels
Key Features
-
Displaying Multiple Levels:
- The script showcases five levels, each with a unique color for clarity.
-
Distinct Line Style for the Centerline:
- The zero centerline is styled differently to emphasize its importance.
-
Theme Compatibility:
- Colors are chosen to ensure good visibility on both light and dark themes.
-
Adjusting Indicator Values:
- Since the built-in
talib.tsi()function returns values in the range of+1to-1, the script adjusts these values to match the usual range of+100to-100.
- Since the built-in
Fills Between Levels
- The space between two levels plotted using
hline()can be filled with colors using thefill()function. - Requirement: Both levels must be plotted using
hline()for thefill()function to work.
Example Use Case
The example below demonstrates how to enhance the TSI indicator by adding background fills between levels. This visual enhancement makes it easier to interpret the indicator’s behavior across different ranges.
Notes:
- Five levels are displayed, each with a distinct color.
- The zero centerline uses a different line style for better distinction.
- Colors are selected to ensure compatibility with both light and dark themes.
- The indicator’s typical range is
+100to-100. Since thetalib.tsi()built-in function outputs values between+1and-1, the code adjusts these values accordingly.
Fills Between Levels:
- The
fill()function can be used to color the space between two levels plotted withhline(). - Note: Both levels must be created using
hline()for thefill()function to work.
The example demonstrates how to apply background colors to the TSI indicator for enhanced visual clarity.
indicator("TSI")
myTSI = 100 * talib.tsi(close, 25, 13)

plus50Hline = hline( 50, "+50", color.lime)
plus25Hline = hline( 25, "+25", color.green)
zeroHline = hline(0, "Zero", color.gray, style=hlineStyle.dashed)
minus25Hline = hline(-25, "-25", color.maroon)
minus50Hline = hline(-50, "-50", color.red)

// ————— Function returns a color in a light shade for use as a background.
fillColor(color col) => color.new(col, .1)

fill(plus50Hline, plus25Hline, color = color.new(color.lime, 0.1))
fill(plus25Hline, zeroHline,  color = color.new(color.teal, 0.1))
fill(zeroHline, minus25Hline, color = color.new(color.maroon, 0.1))
fill(minus25Hline, minus50Hline, color = color.new(color.red, 0.1))

plot(myTSI)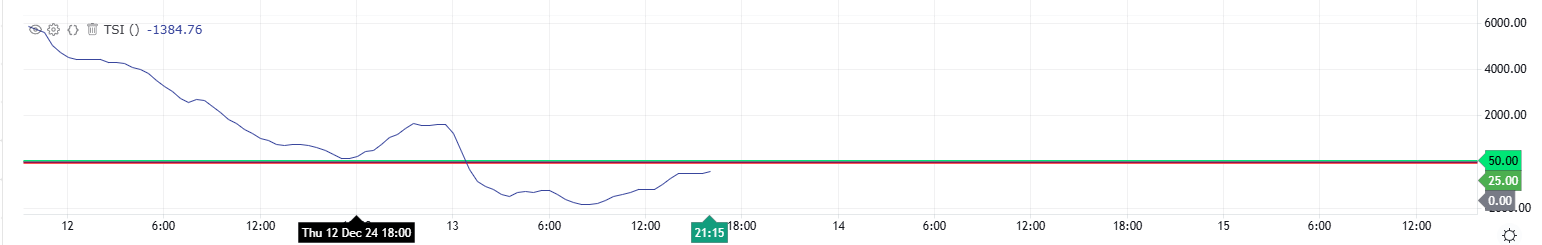
Notes:
- The return values from our
hline()function calls are stored in variables of thehlinespecial type. These include theplus50Hline,plus25Hline,zeroHline,minus25Hline, andminus50Hlinevariables. These “hline” IDs are important for laterfill()calls. - To create lighter color shades for the background, a
fillColor()function is defined. This function takes a color as an argument and returns it with 90% transparency. This function is then used to adjust the colors in thefill()calls. - The
fill()function is called four times to fill the space between four different pairs of levels. - For the second fill,
color.tealis used instead ofcolor.greento match the color scheme more effectively, as it provides a better green shade for the 25 level.