CHART Tab – Visual & Flow-Based Trading
The Chart Tab provides a rich, visual, and interactive environment for trading. It is ideal for technical analysis, order flow strategies, and discretionary trading with a clean and customizable interface.
Chart Customization and Types
Time Intervals
Choose from a wide range of intervals, including second-based charts (like 5s, 15s, etc.) for high-frequency trading.
Chart Types
- Area
- Line
- Candlestick
- Hollow Candle
- OHLC
- Heikin Ashi
- Line Break
- Renko
- Kagi
- Point and Figure
- Elder Impulse
- Range Bar
Order Flow Charts
Select Imbalance or Cluster chart types to access advanced order flow views (exclusive in India).
Indicators and Studies
Use the Study option to add your preferred technical indicators.
Settings Panel
Access detailed customization under the Settings option:
- Chart
- Axes
- Coordinates
- Legend
- Events
- Order Flow
- Sessions
- Books
- Options
- Trading
- Broker
These are the same settings available in GoCharting’s standard charting platform.
Layers and Drawings
- Use the Layer option to adjust the visibility and hierarchy of indicators and drawings.
- On the Left Sidebar, you’ll find drawing tools and other annotation features.
Multi-Chart View and Strike Control
By default, three charts are displayed:
- Index or Futures chart (selectable from bottom dropdown)
- Call Option chart
- Put Option chart
Each chart includes Buy and Sell buttons with shortcut key support, similar to the Grid tab.
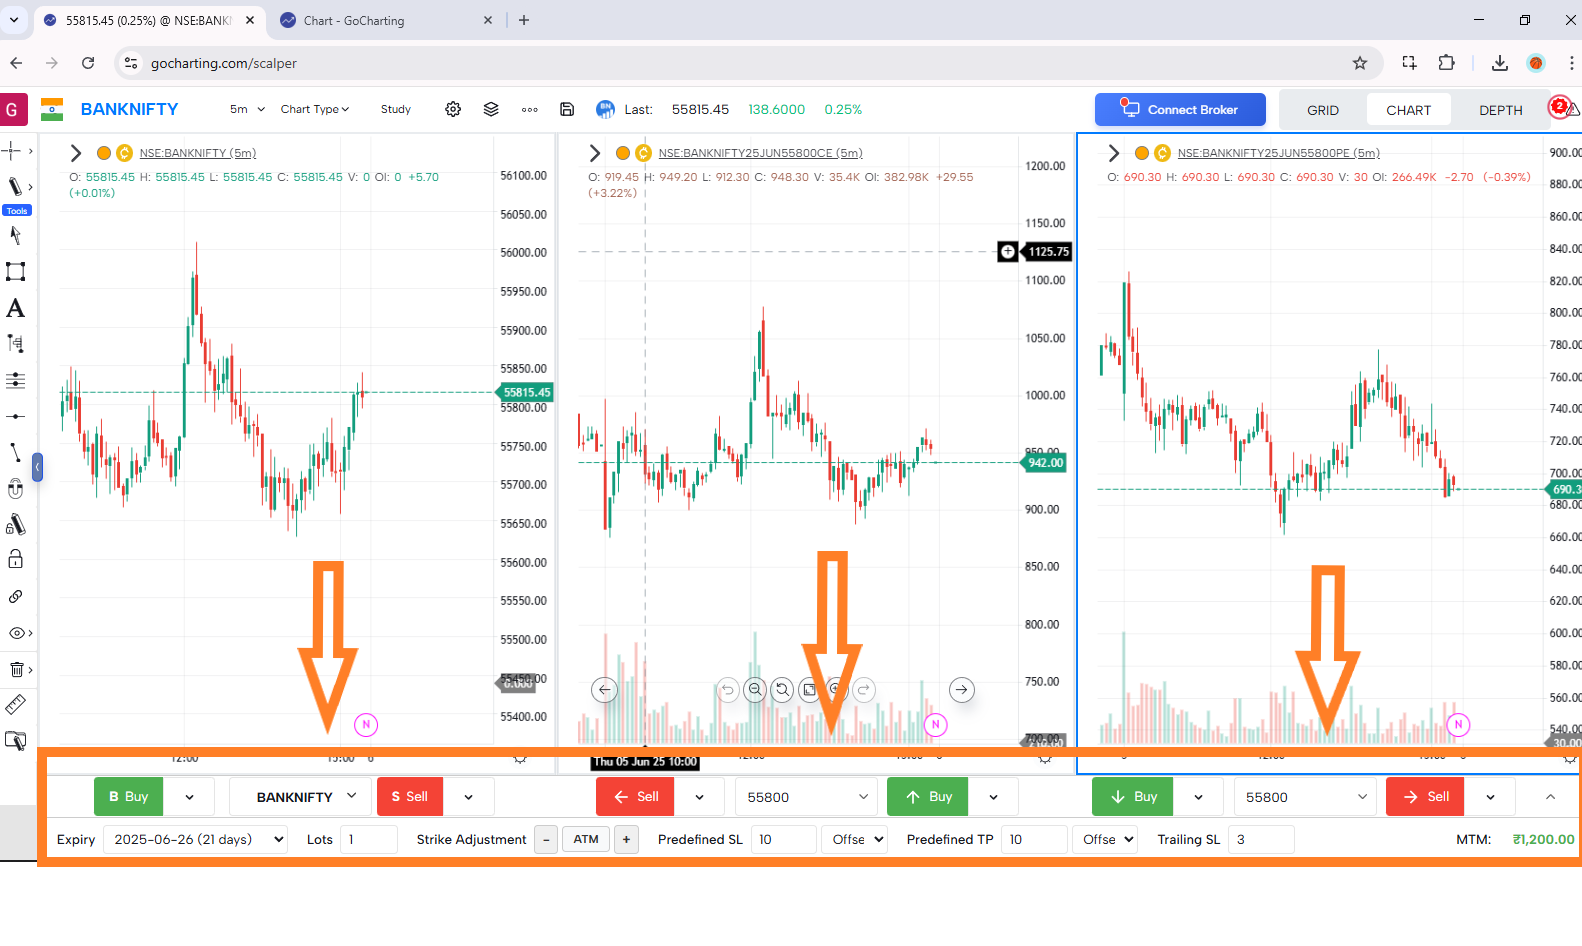
📌 Lower Bottom Bar – Quick Order Configuration
The bottom bar in the GRID tab provides quick access to essential order settings to streamline your trading process:
| Field | Description |
|---|---|
| Expiry | Select the expiry date for the options contract. This determines which series (weekly/monthly) you’re trading. |
| Lots | Set the number of lots to be traded per order. |
| Strike Adjustment | Choose ATM, ITM, or OTM strikes for quick strike selection. |
| Predefined SL | Set a predefined Stop Loss value in points for bracket orders. |
| Predefined TP | Set a predefined Target Profit value in points for bracket orders. |
| Trailing SL | Configure the Trailing Stop Loss in points to lock in profits as the trade moves in your favor. |
| MTM (Mark-to-Market) | Displays your current unrealized P&L in live or paper mode, based on your open positions. |
💡 These settings ensure quick and consistent order execution. Once configured, you can place trades with minimal input using the central trading panel.

Chart Interactivity
Zoom and Toggle View
Hover over any chart to see options for Zoom In, Zoom Out, or Toggle to maximize that chart to full screen.
Placing Orders from the Chart
- A Plus (+) Button appears near the current price (LTP).
- If your cursor is above the LTP, clicking the + button gives a Sell Limit option.
- If your cursor is below the LTP, clicking the + button gives a Buy Limit option.
Manage Orders Directly on the Chart
- Once a trade or limit order is placed:
- SL (Stop Loss) and TP (Take Profit) lines appear on the chart.
- You can drag and modify these lines directly to adjust stop-loss, take-profit, or limit prices.